The application collects information about users, their interactions, and the characteristics of these interactions, such as session duration. In addition, data is gathered on the performance of individual subpages of the website, enabling a comprehensive analysis of user behavior.
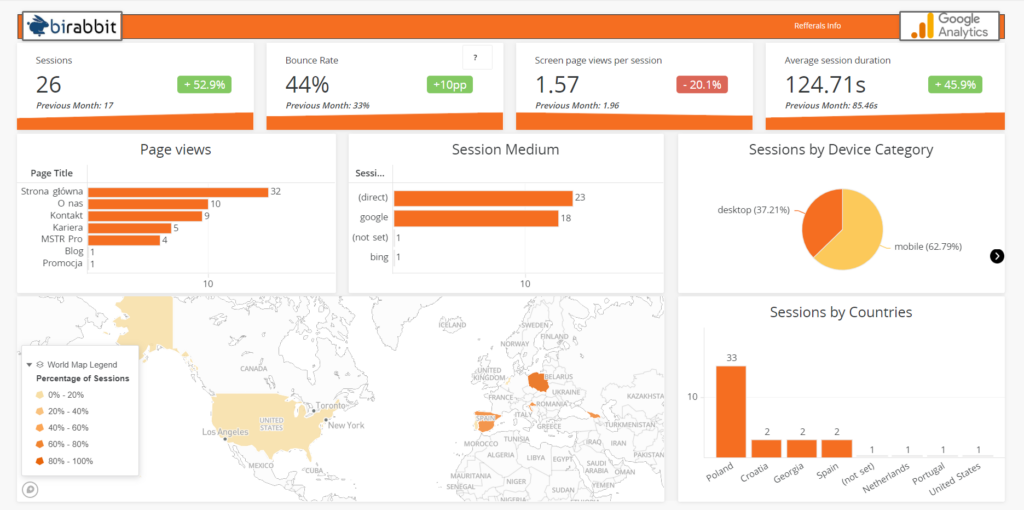
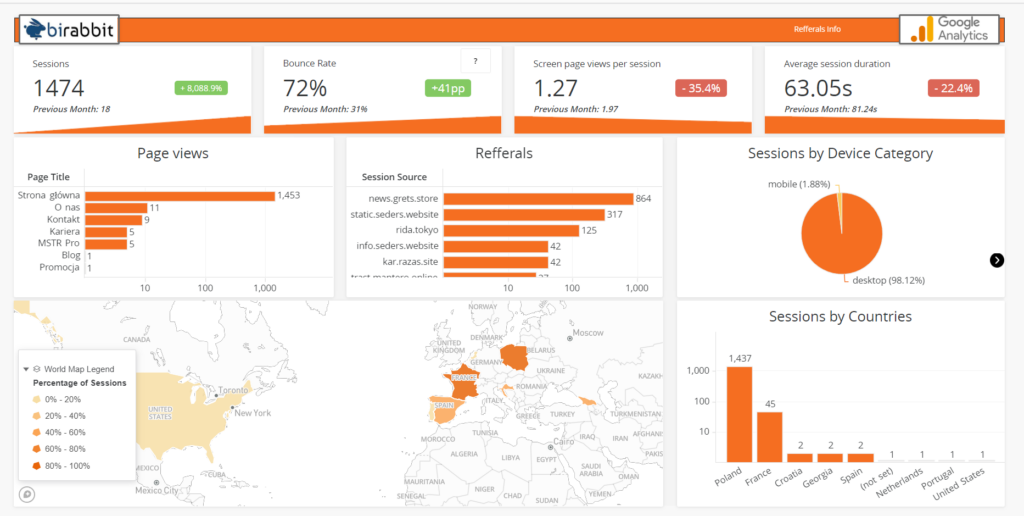
The application offers the option to include data from various reference sources or filter them out entirely. It consists of two pages: the first presents the key performance indicators (KPIs) for the selected month, such as the number of sessions started, bounce rate, average number of subpages visited per session, and average session duration expressed in seconds. Each highlighted KPI includes a comparison with the previous month. Additionally, the first page contains visualizations showing the distribution of views for individual subpages, the percentage breakdown of sessions on the site by the type of device used to start the session, and visualizations based on geographic data.
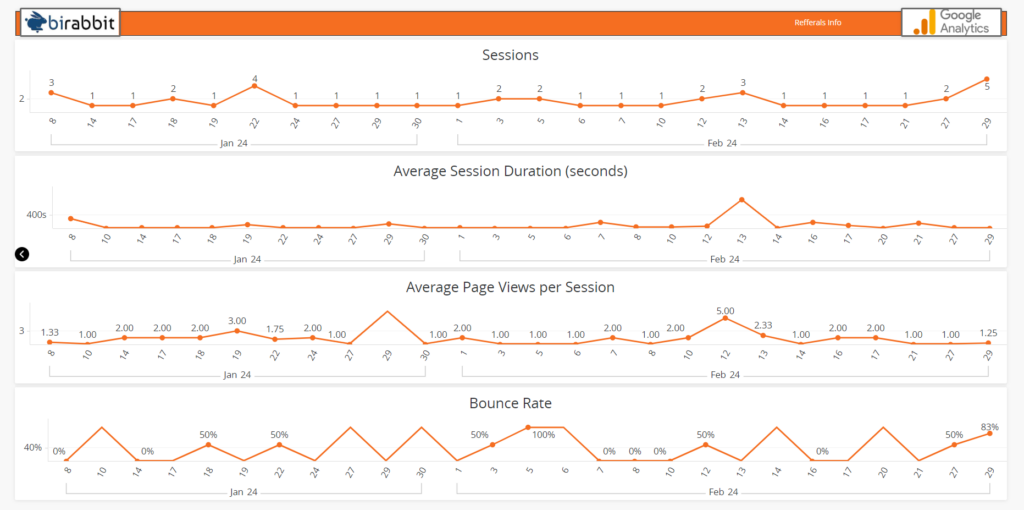
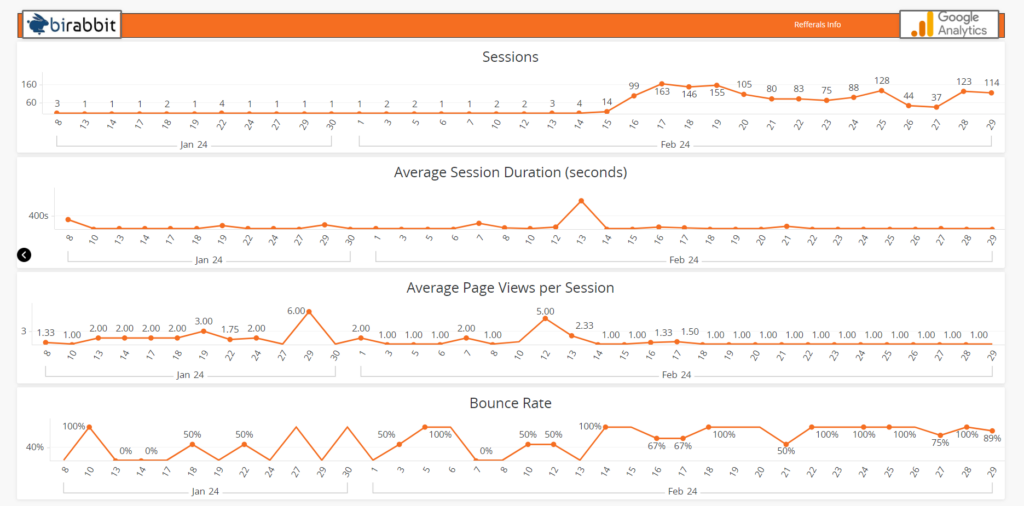
The second page focuses on presenting the same key indicators in a time-based context to facilitate the identification of trends.
The main idea behind creating the application was to combine the functionality of Google Analytics with the MicroStrategy platform and demonstrate the potential resulting from the synergy of these two solutions.
Technology:
Google Analytics: This tool was used to collect data about users and their interactions on the company’s website. It provided deep insight into user behavior.
Google Cloud Console: The Google Cloud Console was used to configure the connection between the Google Analytics platform and MicroStrategy. This tool enabled seamless data integration, which was crucial for our application.
MicroStrategy: Using MicroStrategy, we created a Dossier that enables comprehensive analysis of the data collected by Google Analytics. Thanks to MicroStrategy’s features, visualizations were created, allowing data to be presented in a clear and understandable way for users.