Level metrics are a very important topic in advanced MicroStrategy reporting. By the term level metrics we understand metrics that are calculated at a specific, predefined level of data.The level of a metric, also called its dimensionality, consists of the following three elements:
Target: If you specify an attribute as the calculation level of the metric, then the default level at which the metric is calculated is replaced by this attribute.
Filtering: Defines how the report filter affects the calculation of the metric. For example, if a report displays revenue metric data across different product categories, and the report filter includes only Electronics and Clothing, you can decide whether to include only data related to Electronics and Clothing when calculating the metric, or conversely, you can force the metric to ignore the report filter.
Grouping: Defines how the metric is aggregated. For example, you can choose grouping and calculation of metric data based on a selected attribute as the target.
Standard (default): Only data meeting the conditions in the report filter are included in the metric calculations.
Absolute: Raises the level of the report filter to the level of the target if possible, and then applies the report filter to the metric calculations. For example, the report filter contains the following elements of the Distribution Center attribute: Boston and New York, but the Revenue metric is calculated at the Region level. Since Distribution Center is a child attribute of Region, the report filter level is raised to the Region level, and the report filter is treated as if it includes regions containing Boston and New York. Data from all Distribution Centers in the regions included in the report filter are used in the metric calculations, even if they are not Boston or New York.
Ignore: Ignores conditions in the report filter based on the attribute selected in the target of the level metric, as well as on any parent or child attributes relative to the target. For example, if we use a regional revenue metric in the report, any conditions based on an attribute from the same hierarchy (e.g., Country) in the report filter are ignored when calculating the metric. A condition based on attributes from another hierarchy (e.g., time) will not be ignored.
None: Leaves unspecified the relationship of the metric to the report filter. Instead, the options of target and grouping define the level of the metric.
Standard (default): Groups metric data by the level of the target attribute in the level metric.
None: Excludes the target attribute from the grouping of metric data. Any children in the hierarchy of the target attribute are also excluded. This option is available for metrics calculated at a specified level, as opposed to the report level.
The remaining options are used only for non-aggregatable metrics. A non-aggregatable metric is one that should not be aggregated within an attribute.
Beginning lookup: Uses the first value in the Lookup table.
Ending lookup: Uses the last value in the Lookup table.
Beginning fact: Uses the first value in the fact table.
Ending fact: Uses the last value contained in the fact table.
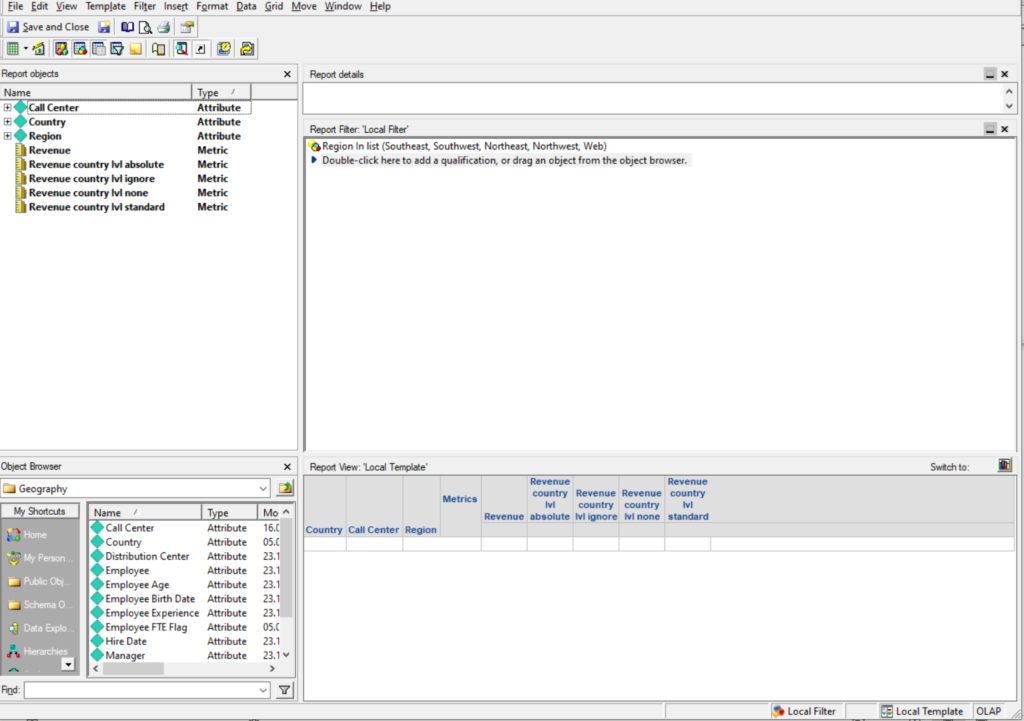
The dataset used in the example contains 3 attributes from the same geographical hierarchy, 5 metrics: 1 at the report level (default level) and the remaining at the Country level with various filterings. In addition, the dataset contains a Report Filter reducing the number of Call Centers included.
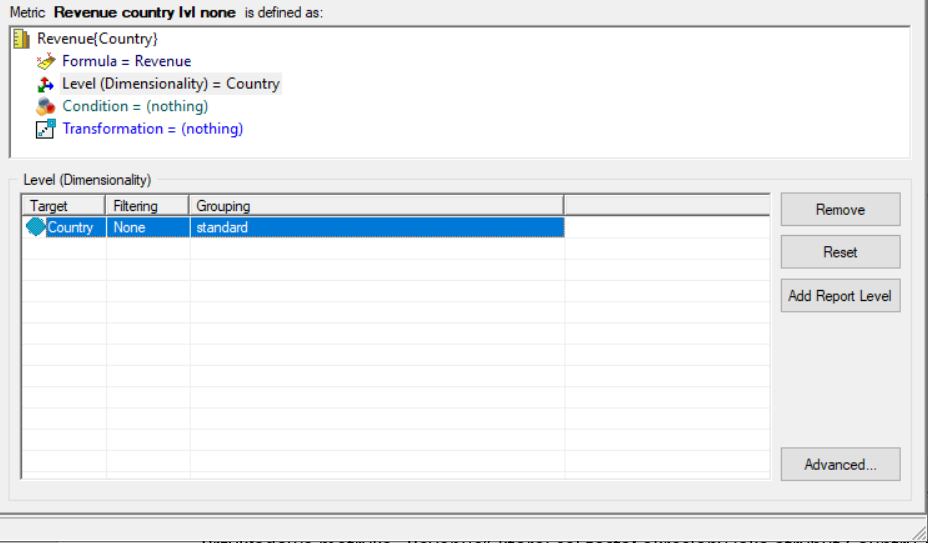
Example metric “Revenue country lvl none,” whose target has been defined as the Country attribute, filtering set to None, and grouping set to Standard.
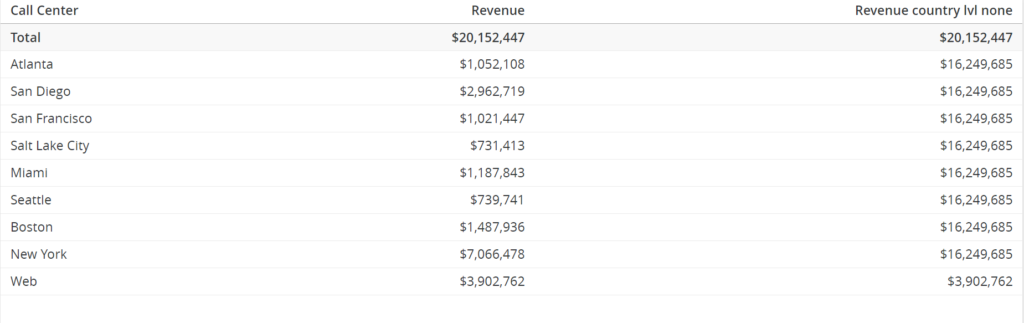
In the presented table there is a comparison of Revenue metrics at the default level, i.e. dynamically aggregating to the lowest attribute level from the hierarchy present in the table (in this case Call Center), and the Revenue metric at the Country level with filtering set to None.
In this particular case the Revenue metric calculates revenue for each individual Call Center separately, whereas the second metric aggregates at the Country level. It is worth noting that the values in many rows are repeated. This is because several Call Centers are assigned to a given country. However, the repeated values did not affect the Total. This metric is not affected by chapter filters or filters applied directly on the visualization. However, it is affected by report filters at the dataset level. This happens because the filtering of this metric has been set to None.
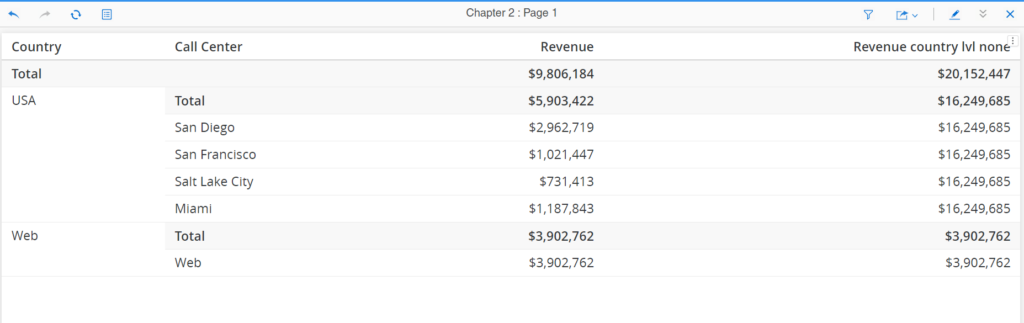
Despite filtering the visualization, the results for the “Revenue country lvl none” metric remain unchanged.
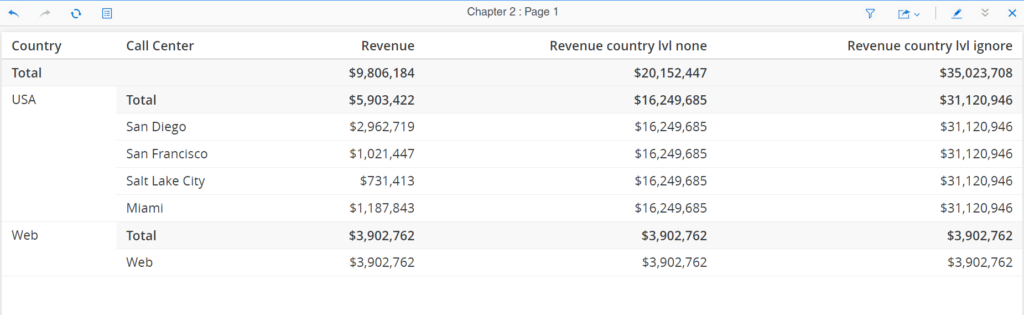
The situation is different in the case of the Revenue metric with filtering changed from None to Ignore. This type of filtering ignores not only chapter filters or filters applied on visualizations, but also report filters included directly at the dataset level. Thanks to this, in this case all Call Centers that were excluded in the dataset report filter were nevertheless included in the metric calculations.